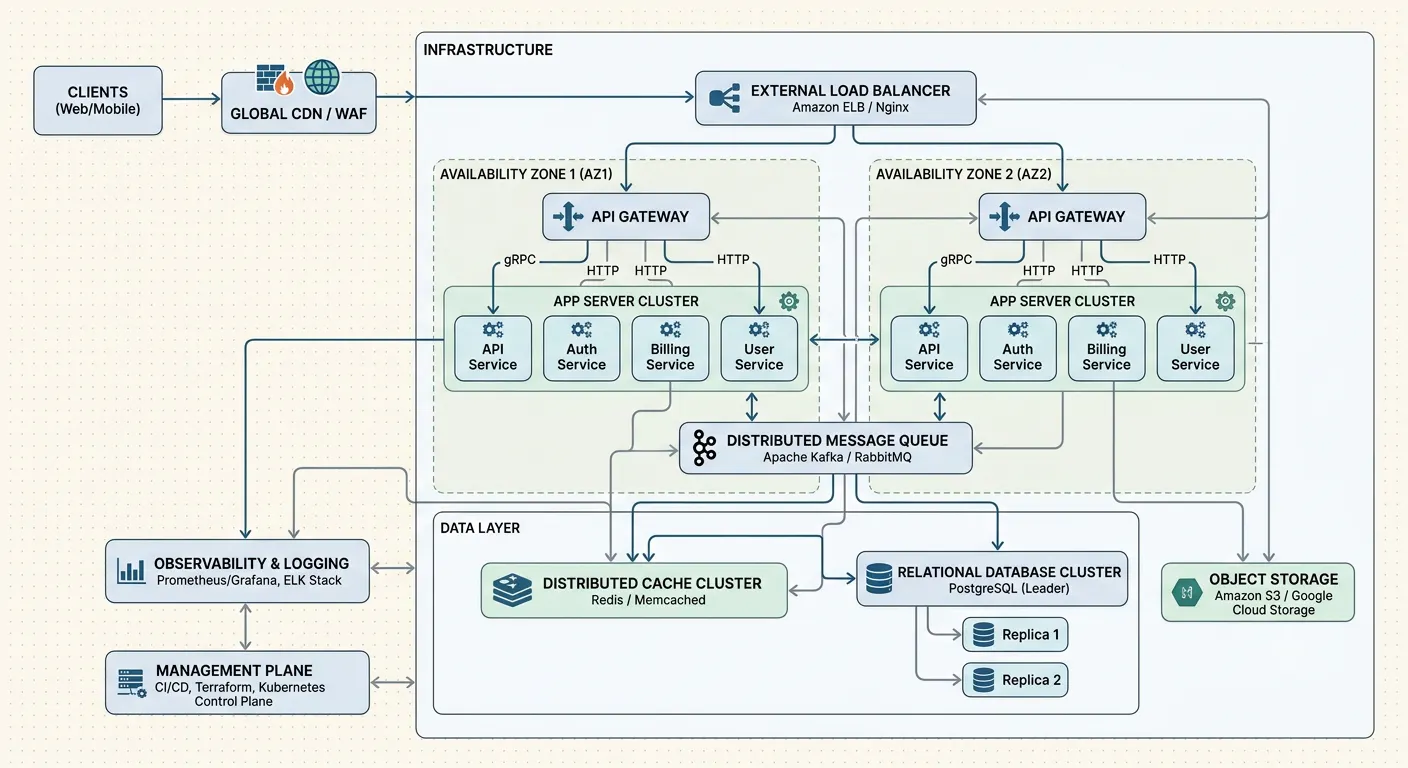

What It Took to Get Useful Metrics Out of Nginx
The whole thing started with one plain, annoying question: how do we get real metrics out of nginx?
Nginx sits in front of basically everything we run, terminating connections, proxying requests, doing its job quietly the way nginx always does. And we had almost no idea what it was actually doing at any given moment. Access logs, sure. But access logs are not metrics. You can’t put an access log on a Grafana panel and watch it move. You can grep it after something’s already broken, which is a very different thing from knowing it’s breaking while it happens.
Nginx won’t tell you anything
Turns out nginx does not expose real metrics by default. Stock nginx ships with stub_status, and that's the entire offering:
location = /basic_status { stub_status;}
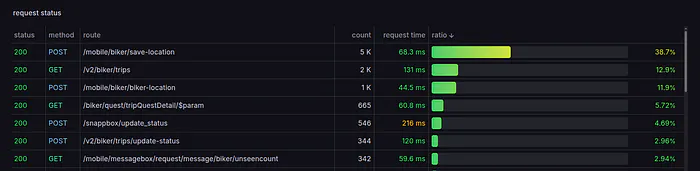
Four numbers. Active connections, accepts, handled, requests. No per-route latency. No per-status breakdown. Nothing that tells you which endpoint is slow...
Copyright of this story solely belongs to hackernoon.com. To see the full text click HERE