
Designing Data Products Around Uncertainty
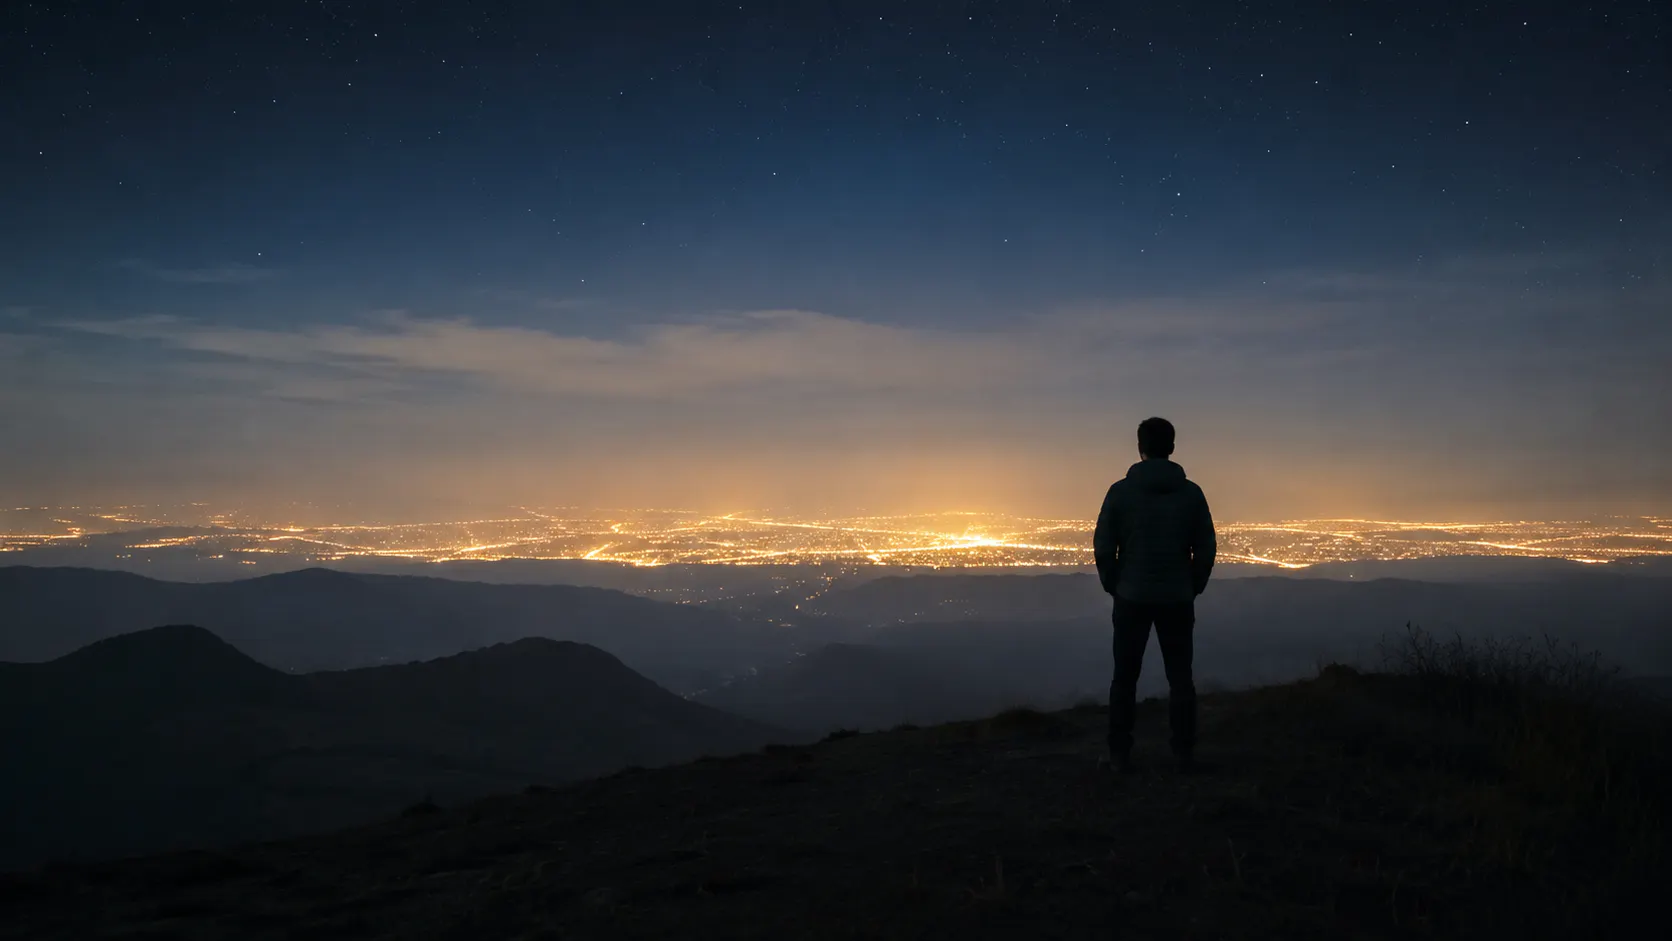
I built a light pollution map (link at the end of the article). Click anywhere, and you get a Bortle class, a sky-brightness (SQM) value, a rough count of naked-eye stars, a suggested camera exposure time, a multi-year brightness trend.
Not one of those is a measurement. They're all derived from a single satellite raster — NOAA's VIIRS night-light composite for 2024 — pushed through a chain of simplified formulas. The radiance-to-brightness step is a fitted log curve, not an atmospheric model. The Bortle class is binned from that modeled value. The star count is estimated from the Bortle class. The exposure suggestion adds a noise-budget model with an empirically calibrated constant on top.
Every one of those numbers could be wrong in a specific, predictable direction, and I know roughly which direction for each. The interesting product question isn't how to make them more accurate — the data has...
Copyright of this story solely belongs to hackernoon.com. To see the full text click HERE