

How to Tell Whether Your Slow Query Is a Planning or an Execution Problem
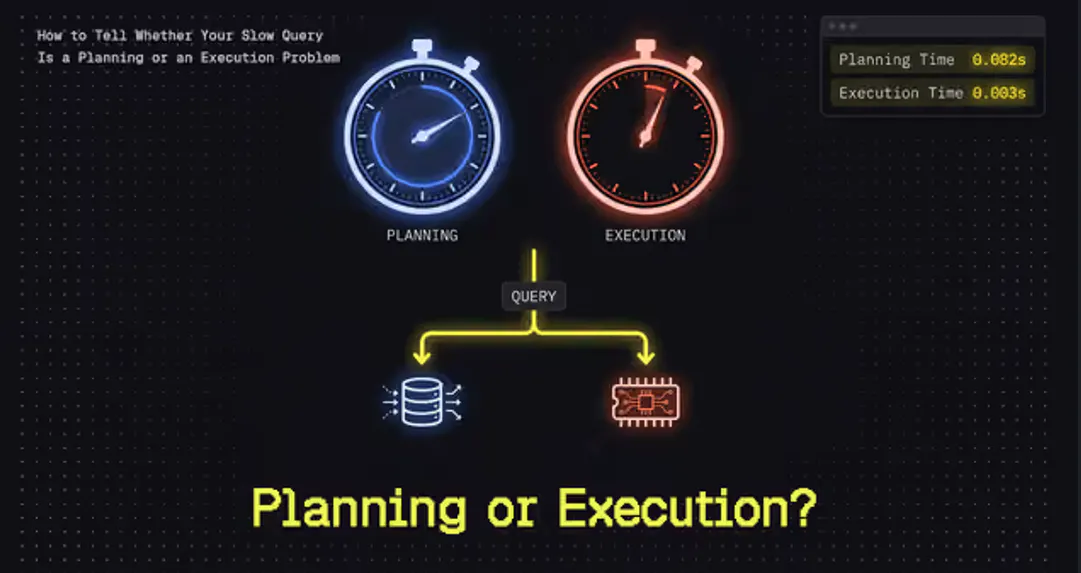
Every EXPLAIN ANALYZE prints two numbers at the bottom, and most engineers read only one of them. Planning Time is how long Postgres spent deciding how to answer your query, while Execution Time is how long it spent actually answering it. When latency climbs, those two numbers point to opposite fixes: plan caching and fewer partitions on one side, memory and storage layout on the other.
Getting this backwards is expensive. On a table with 500 daily partitions, planning a simple time-range aggregate takes nine times longer than running it, and the reflex to add another index makes the problem worse. Every new index adds a path the planner has to consider, plus write amplification on a table that was already write-bound. You’ll end up spending weeks optimizing the phase that wasn't slow.
The good news: Postgres tells you which phase is slow, for free, in one command.
Every plan...
Copyright of this story solely belongs to hackernoon.com. To see the full text click HERE