

How to Diagnose Latency Using p50, p90, and p99
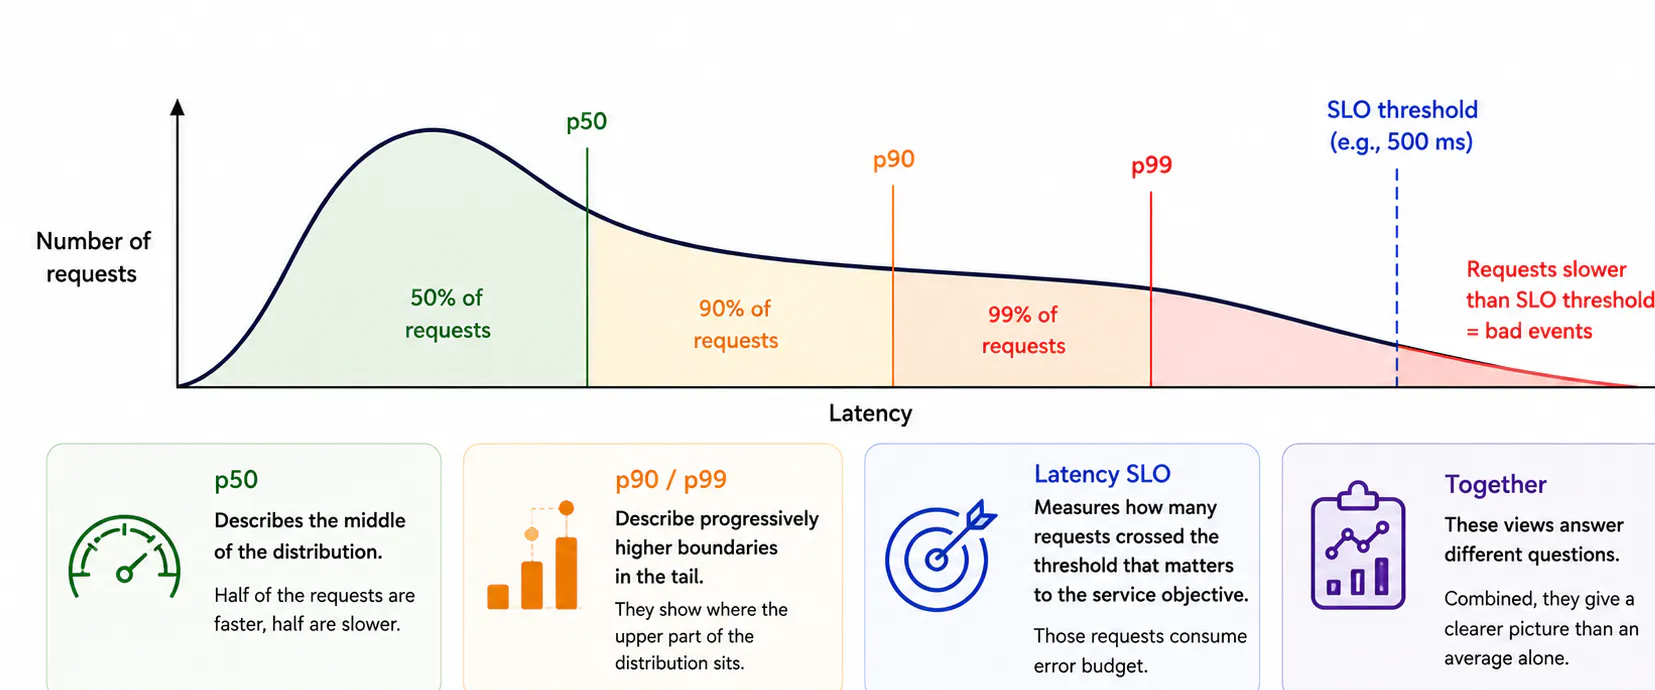
From what I have experienced most app. observability dashboards start with an average because it is familiar and easy to calculate. If an exporter gives you the usual histogram _sum and _count metrics, rate(sum) / rate(count) gives you mean latency, but the number it produces is not necessarily representative of what a typical request experienced.
Latency distributions are usually right-skewed. Most requests might complete within a relatively narrow range while a small number take significantly longer, and those slower requests can pull the mean away from the centre of the distribution.
Percentiles describe that distribution differently, and looking at several of them together gives more information than either the mean or a single percentile on its own.
p50 and the mean
Take a simple example where 99 requests complete in 10 ms and 1 request takes 5 seconds.
The median, or p50, is 10 ms. The mean is roughly 60...
Copyright of this story solely belongs to hackernoon.com. To see the full text click HERE